Kentico's web analytics are a great tool within the platform. One of the only limitations I've come across is that when using Google Analytics, there's often data captured that aren’t available in Kentico. Fortunately, there's a way to embed this key data into Kentico’s web analytics dashboard. I've found this to be an amazing tool that gives me all the analytics information I need in a single, simple reporting interface.

Step 1: Creating your API Key
Google Analytics has a simple-to-use embed API that lets you embed reports into any site. While it’s not terribly hard to use, you do need to create an API key first, which is a somewhat involved process. This is done through the Google Developer Dashboard.
If you don’t already have an account, go to developers.google.com and create one.
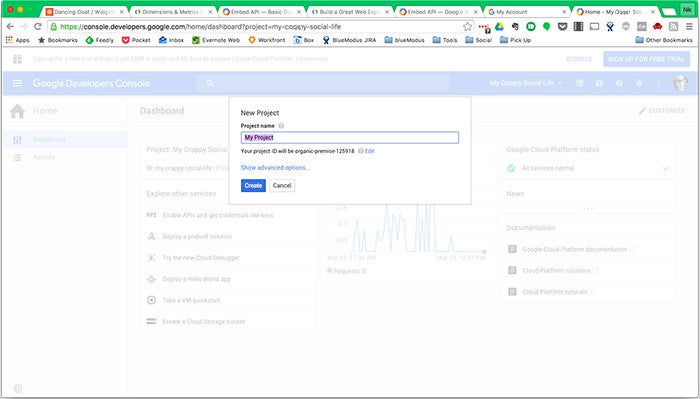
Once you’ve done this, go to your console (console.developers.google.com) and create a new project:
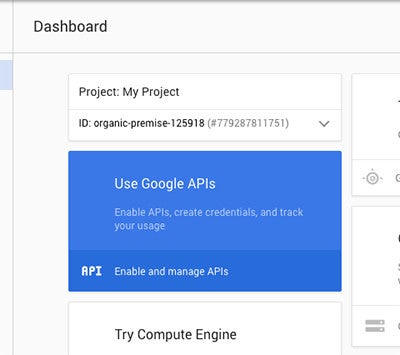
Click on the Enable and Manage APIs link to create your analytics API key:
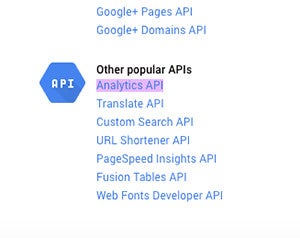
And then on the Analytics API:
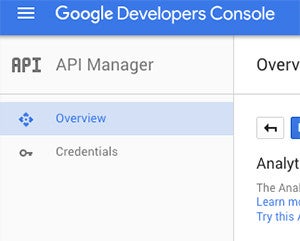
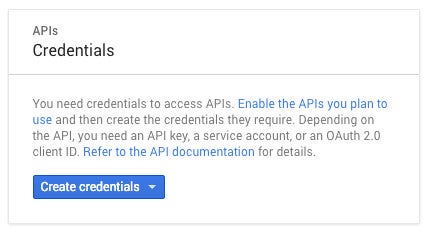
Click on Credentials:
And then create an Oauth Client Key:
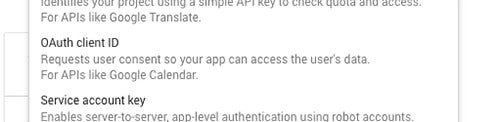
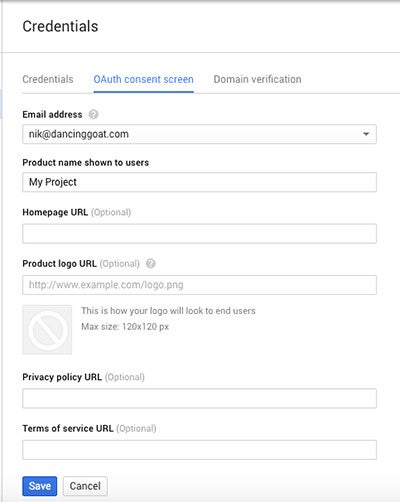
Give your project a name, then you will want to select “Web Application", and add all the domains you are going to use on the following screen:
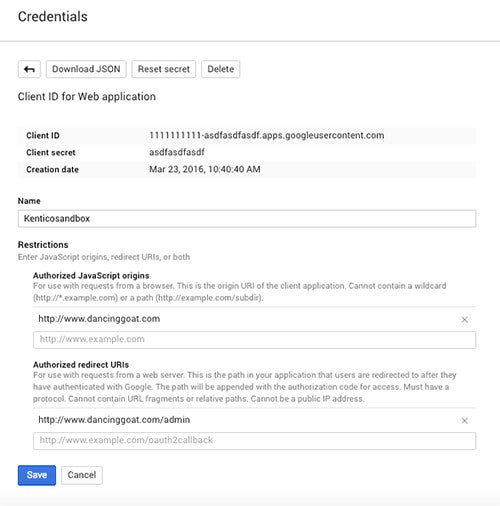
Make note of the “Client ID”, as you will need it later. (You can always go back to the console and retrieve it.)
Now that you have your API key, you're ready to create your dashboard widget!
Step 2: Configuring Kentico
Configuring Kentico takes just a couple of steps.
First you'll need to enable the “Static HTML” widget to work in Dashboard zones.
Go to the Widgets application, click the pencil next to the "Static HTML" widget, and enable it to work in Dashboard zones within the Security Settings tab.


Now go to your Web Analytics page, and add a new Static HTML widget to your dashboard.

Within that widget’s properties, paste in the following code: https://pastebin.com/x5egjtRZ
Once you've pasted in this code, note that on Line 25, there’s a space to put in your analytics ID - insert the Client ID you created in the Google developer console here.

This script will embed tracking of custom events, an overview of your Google AdWords response, and a chart of goal completions - all filtered to the last 30 days.
Save your widget, and your dashboard will reload with a button to enable GA on your site. Click the button and you will go through a quick authorization flow.
Once authorized, you will be able to select any of the GA properties you have access to, and can view metrics for any of them.
Going Further
Building and customizing your own dashboards can admittedly be a bit involved, but Google offers great tools to help get the job done. If you use the code I’ve provided as a starting point, you can see generally how it works from the code. To do your own further customization, I've found that Google offers a great API reference to find all of the information you need, as well as a bunch of examples.
https://developers.google.com/analytics/devguides/reporting/embed/v1/
If this tutorial helps you out, I’d love to see some screenshots of custom dashboards you create. Please also share the JavaScript snippets you’re using to create them.
Happy data mining!